Histograms with GNUPlot and LaTeX
(27 August 2011)
Gnuplot is a program for plotting functions and data. It can be used for creating plots suitable for inclusion in LaTeX documents. For my master's thesis, I wanted to present some data in a stacked histogram. There are some examples on the Gnuplot web site, but I found it tricky to get it right.
The data looked like this (results.dat):
"Benchmark"     "Compile"   "HW"        "Exec"
"$A$"           12.25       165.36      80.77
"$A_{opt}$"     15.18       149.68      57.16
"$B$"           12.28       85.46       38.2
"$B_{opt}$"     15.15       78.13       26.38
"$C$"           11.07       0           188.06
"$C_{opt}$"     14.00       0           110.98
"$D$"           9.99        0           335.11
"$D_{opt}$"     12.65       0           198.63
The first row contains the column headers. The subsequent rows contain three measurements, "Compile", "HW", and "Exec", for different benchmarks. For each benchmark, we want the three time values stacked on top of each other to form the bar for that benchmark.
Note that TeX notation is used, i.e. we can write $A_{opt}$, and LaTeX will typeset it as expected.
The Gnuplot code looked like this (results.gnuplot):
set terminal epslatex newstyle size 12cm,8cm 10
set output "results.gnuplot.tex"

set boxwidth 0.9 absolute
set xtics nomirror
set grid ytics
set style data histogram
set style histogram rowstacked
set style fill pattern 0 border -1
set key left top vertical invert
set ylabel "Time (s)"
set key autotitle columnheader height 1
plot "results.dat" using 2, '' using 3, '' using 4 :xticlabels(1)
Running the program (gnuplot results.gnuplot) produces two output files: results.gnuplot.eps and results.gnuplot.tex. To use it in a LaTeX document, one might write something like this:
\documentclass{article}
\begin{document}

\begin{figure}[ht]
    \begin{center}
        \resizebox{\width}{!}{\input{results.gnuplot.tex}}
    \end{center}
    \caption{Benchmarks before and after optimisation.}
    \label{fig:results}
\end{figure}

\end{document}
This fails with the following error:
! LaTeX Error: Cannot determine size of graphic in results.gnuplot
(no Bounding Box).
The problem is that results.gnuplot.tex contains the code \includegraphics{results.gnuplot}. Since there is a file named results.gnuplot, that will be included instead of results.gnuplot.eps. We can fix this, either by editing the file manually, or with Sed:
$ sed -i 's/includegraphics{\([^}]*\)}/includegraphics{\1.eps}/' \
	results.gnuplot.tex
We can now compile our LaTeX document to PDF like this:
$ latex histogram.tex
$ dvips histogram.dvi
$ ps2pdf histogram.ps
The generated PDF can be viewed here.
The plot looks like this:
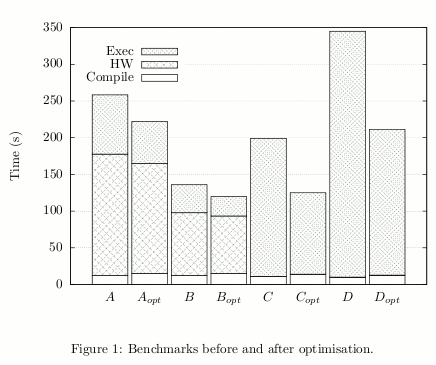
The careful reader might notice that the PDF title is wrong: the name of the Gnuplot output, results.gnuplot.tex, has overridden the title of our document.
There is a discussion in comp.graphics.apps.gnuplot about this. One way to fix it is to manually remove the \Subject, \Author, etc. tags from the EPS file generated by Gnuplot. Or with Sed:
$ sed -i 's/\/\(Title\|Subject\|Creator\|Author\|CreationDate\).*//' \
	results.gnuplot.eps
Summary
So to create our plot from results.gnuplot and results.dat, and compile our LaTeX document, we run the following commands:
$ gnuplot results.gnuplot
$ sed -i 's/includegraphics{\([^}]*\)}/includegraphics{\1.eps}/' \
	results.gnuplot.tex
$ sed -i 's/\/\(Title\|Subject\|Creator\|Author\|CreationDate\).*//' \
	results.gnuplot.eps
$ latex histogram.tex
$ dvips histogram.dvi
$ ps2pdf histogram.ps
This may seem like a lot of work, but if one uses a Makfile or shell script to compile the document, it shouldn't be any trouble.
Inline data
Sometimes it can be annoying to have to put the data in a separate file from the Gnuplot script, especially when the data is small.
Using the special - filename for the plot command (see help special-filenames) makes Gnuplot read the data directly from the lines after the comment. This is similar to how the unix << heredoc works. Use e on a line of its own to signal end of inline data.